Trade journal: what to include and how to review it
A trade journal records every trade with entry, exit, size, result, setup and reasoning, plus how you felt and which rules you broke. The value comes from the review: after 20 to 50 entries, win rate, profit factor and a breakdown by setup or time of day show which habits are costing you money.
Updated:
How do you keep a trading journal?
Log each trade right after you close it, not at the weekend; otherwise you lose exactly the details that later explain why it went wrong. One line per trade is enough as long as the fields stay the same.
The honest note matters as much as the numbers: did you have a plan, did you move the stop, was it a revenge trade after a loss? Those columns turn a copy of your statement into a tool for self-control.
- Before entry: write down the setup, planned entry, stop, target and your risk in money.
- After closing: actual exit, result after fees and a chart screenshot.
- One word for your state of mind (calm, impatient, FOMO) and whether you broke one of your rules.
- Review once a week: which setup, which hour, which mistake cost you most?
What should a trading journal include?
The fields below work for almost any market, whether stocks, forex, futures or crypto. Keep result and risk in the same currency; then every trade can also be expressed in R, a multiple of your planned risk.
| Field | Example | Why |
|---|---|---|
| Date and time | Nov 18, 3:42 pm | reveals your good and bad hours |
| Symbol, direction | NQ, long | review by market |
| Entry, stop, target | 18250 / 18225 / 18300 | planned reward-to-risk |
| Size | 1 contract | checks your position sizing |
| Result after fees | +495.80 | the number that counts |
| Planned risk | 250 | result in R (here +1.98 R) |
| Setup | pullback | which strategy pays |
| Emotion, broken rule | calm, none | finds costly habits |
What is profit factor and which stats should you review?
Win rate alone says little: someone who wins 40 percent of trades but makes twice as much as they lose is ahead. Profit factor (gross profit divided by gross loss) and the average result per trade tell you more.
Worked example with 20 trades: 9 winners averaging $120, 11 losers averaging $70. Gross profit $1,080, gross loss $770. Win rate 45 percent, profit factor 1,080 / 770 = 1.40, average per trade (1,080 − 770) / 20 = $15.50. With so few trades this is only a snapshot; the numbers become meaningful with more entries.
- Win rate: winners divided by all trades.
- Profit factor: above 1 means profits exceed losses.
- Maximum drawdown: the largest drop from the account’s peak.
- Result by setup, weekday, hour and emotion: shows where the money leaks.
How do you calculate position size?
Many traders fix in advance the share of the account a single trade may cost at most, often 0.5 to 2 percent. Position size then follows from that amount and the distance between entry and stop.
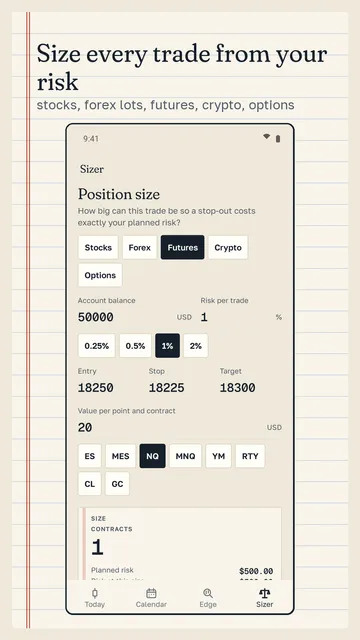
Stocks: $10,000 account, 1 percent risk = $100, entry $50, stop $48. Distance $2, so 100 / 2 = 50 shares. Futures: $50,000 account, 1 percent = $500; NQ at $20 per point, entry 18250, stop 18225 means 25 points × 20 = $500 per contract, so 1 contract. Fees and price gaps can make the actual loss larger than planned.
Trade journal template: spreadsheet or app?
A spreadsheet is flexible and free but needs discipline when logging and your own formulas for the review. An app takes over input and review and goes with you, but ties you to its features. Either way, make sure you can export your data so your history is never lost.
Trading leveraged products such as CFDs, futures or options can lead to losses of your entire capital and, with some products, more. A journal improves self-control; it does not make trading safe and does not guarantee profits.
How Candlet works as a trade journal on your phone
Candlet is a trade journal for Android for stocks, forex, futures, crypto and options: one line per trade, and the review builds itself from there. No account or broker login is needed; trades and screenshots stay on your device.
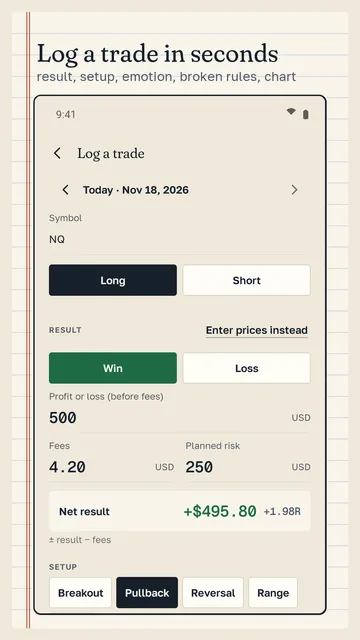
- Log unlimited trades with symbol, long or short, result, setup, emotion and broken rules, plus a chart screenshot for each trade.
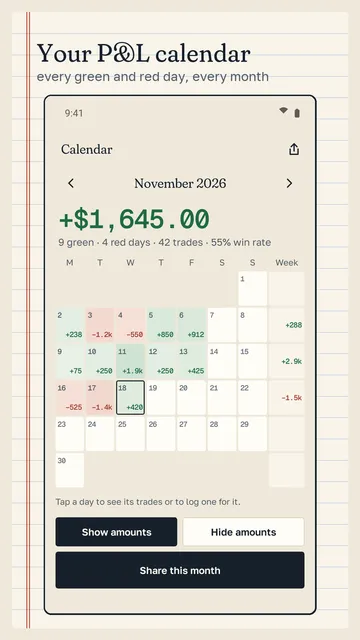
- P&L calendar with green and red days, win rate and every month, shareable as an image.
- CSV import from your broker or MetaTrader, and CSV export of all fields.
- Position size and risk calculator for stocks, forex lots, futures, crypto and options.
- Your biggest “leak” is found automatically after a few trades: the mistake that has cost you most so far.
- With Pro: risk guard (daily loss limit, max trades, drawdown, prop firm challenge target), every leak with a breakdown, and your whole history in the edge report instead of the last 30 trades.
What the app cannot do
Candlet is a journal and calculator, not a broker and not investment advice: it gives no buy or sell signals and does not connect to your brokerage account, so trades come in by hand or via CSV import. The review only reflects what you log; Candlet is available for Android only.
Price
Logging, the calendar, import/export, the calculator and your biggest leak are free; Candlet Pro costs $9.99 a month or $59.99 a year in the US (EUR 9.99 / 59.99 in Germany) and can be cancelled any time in Google Play. The free version shows ads; Pro is ad-free. We build this app ourselves; on Google Play it is listed under the developer name InfinityAkhi.
Get it on Google Play: Candlet
Screenshots
Related calculators on ToolboxDay
Frequently asked questions
How many trades do I need before the review means anything?
First patterns show up after about 20 trades; it gets more reliable from 50 to 100. Single large wins or losses distort small samples heavily.
Should I also log trades I didn’t plan?
Especially those. Impulse trades, revenge trades after losses and moved stops are often the most expensive habits, and they only show up if they are in the journal.
What does R mean in a trade journal?
R is the planned risk of a trade. A $500 win on $250 planned risk is +2 R. That makes trades of different sizes comparable.
Can Candlet pull my trades from my broker automatically?
No, there is no broker connection. You log trades yourself or import a CSV file from your broker or MetaTrader.
Does Candlet give trading recommendations?
No. Candlet only analyses your own entries and is not investment advice. Trading involves risk of loss.
Sources
More guides
- Envelope budget: give every dollar a job before you spend it
- Recurring payments: find them, add them up, cancel what you don’t use
- Lean angle motorcycle guide: how it is measured and what the number means
- Constellation finder: how to find constellations in the night sky
- Oil change reminder: how to time it and never miss it
- Garden layout planner: how to lay out a raised bed step by step
- Our apps